(Or: how much one can get out of drawing circles)
We saw in our previous exploration of our solar system the approximate size of its circumference — if such a thing can be conceived at all.
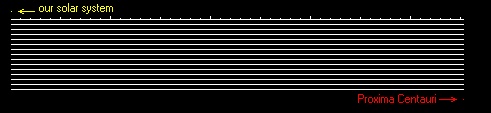
So now let’s imagine our solar system as a small disk, a very small one indeed, and compare it to the distance to the closest star, the one called Proxima Centauri.
How small should our solar system’s disk be (in pixels) to make things fit within our computer’s screen? (I realize that several of you, gentle readers, have spent a lot of money and bought huge screens, but not everybody in the world can follow the fashion, so I’ll assume the minimum possible length in pixels for a computer screen.) Here we have a problem. Even if we represent our solar system by merely one pixel, Proxima Centauri will have to be placed approximately — hold your breath — 6800 pixels away. There is no way you can have such a wide screen. So let’s do the best we can assuming a normal-to-small screen width. In the figure below I placed our solar system’s disk (1 pixel) at the left, “broken down” the distance to Proxima Centauri fifteen times, and placed the pieces one under the other, to make them fit within our pathetic screen resolution.
If you’re thinking “now that’s an astronomical distance”, you ain’t seen nothin’ yet!
Proxima Centauri is actually a tiny red dwarf star, part of a triplet of stars. The other two members of the triplet are significantly bigger than Proxima, and are collectively known as “α (alpha) Centauri”. At this point in stellar history they just happen to be a tiny bit farther than Proxima, in relation to our Sun. (The system, like every system of multiple stars, rotates around its common center of gravity — this one every 81.18 years — so the proximity situation will change in the future.) The bigger of the two, known as “Rigel Kentaurus” (“Foot of the Centaur”) is somewhat larger than our Sun, while the other one is somewhat smaller. Here they are, all three members of the system compared to the Sun:
If the Sun’s diameter is used as a unit and assumed equal to 1, then Rigel Kentaurus has a diameter of 1.2, the diamater of αB Centauri is 0.9, and Proxima’s diameter is at around 0.017. Besides their relative sizes, there is an attempt to depict their approximate colors in the above drawing. Proxima is a red dwarf of low luminosity. Rigel Kentaurus is very similar in color (temperature) to our Sun, while the third member is probably orange. It should be noted that the colors I use here and in the drawings that follow are highly formulaic and approximate. To most people our Sun doesn’t look yellow but rather “blinding white” (though some people report that they see its color as yellowish). This is because our eyes cannot register the color properly at the Sun’s level of brightness. Using a camera, however, and shooting from some distance, the Sun should appear yellowish. Likewise, what astronomers call “blue”, or even “violet” stars, from close up actually should appear white to the eye, both because they are extremely luminous, and because they give off light at all colors of the spectrum (with blue-violet being predominant). An exception to this are cool red stars. If we ever travel real close to Proxima we should be able to notice its redness with bare eyes, but the color would appear much brighter than the one I use in these drawings.
Where would the two main members of α Centauri stand if we placed them in the figure that shows their distance, together with Proxima and the Sun? Here is what we get:
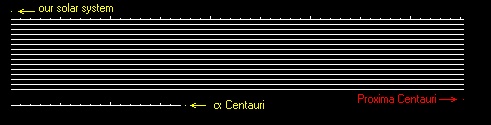
I placed α Centauri 175 pixels away from Proxima, again with the distance wrapped around to the following lines, due to screen limitations. (Notice that I don’t mean that the stars above are on a straight line; all I want to show is their relative distances.) Both stars of α Centauri are represented by a single pixel, since almost all references give exactly the same coordinates for both of them. Their disks, however, are clearly not represented by that pixel — remember, that single yellow pixel at the top represents our whole solar system.
So far we’ve only seen the closest system to our own. What about other stars?
Most stars that are real close to us happen to be red dwarfs, like Proxima, so they are not among those that have attracted your attention while stargazing at the night sky. In fact, many of them can only be seen with a telescope. (This is not a coincidence: like bacteria on Earth, the inconspicuous red dwarfs form the most numerous class of stars in the galaxy). There are a few notable exceptions, however. For example, Sirius, the α of Canis Major, which is “only” 8.65 light-years (l.y.) away (around twice as far as Proxima’s 4.28 l.y.) happens to be about 21 times brighter than our Sun. Another example is Procyon, the α of Canis Minor, at 11.44 l.y., shining like seven Suns.
How could we get an idea of what our immediate neighborhood looks like? I think that the best way is through a 3-D plot, with our Sun at the center. And how can we depict this plot on our 2-D screens? Simple: by constructing a “stereograph”, in which two almost identical figures are presented side-by-side, and the viewer is asked to look at it so that the lines of sight of the eyes become almost parallel, each eye seeing a different image. If you already know how to do this, enjoy the figure below. If not, please click here for instructions (you will not need any tools but your bare eyes, your two index fingers, and some considerable amount of patience!).
Sirius, Procyon, and a few other stars, all closer than 12 l.y. are shown in the figure above, with Sun at the center. If you managed to make the two parts of the figure coincide, you will notice that, from our vantage point, α Centauri lies somewhat to the back of our Sun in the third dimension, while Sirius stands out in front. Further in front we see epsilon Eridani, and even more so, τ (tau) Ceti. These two smaller-than-Sun stars (0.7 solar diameters) lie at distances of 10.79 and 11.77 l.y. respectively. (Did you notice the tiny red dot next to alpha Centauri? it is supposed to represent Proxima Centauri.) Of the other stars, we should mention that to the upper-right-back of the Sun we see Barnard’s star, the second closest to us (if we count the triple system at α Centauri as one), at a distance of 5.91 l.y. Barnard’s star, in the constellation of Ophiuchus, is another example of a red dwarf, about twice as large as Proxima. To the Sun’s upper-left-back we see “Lalande 21185”, the fourth closest star (8.21 l.y.), in the constellation of Ursa Major (the Big Dipper).
So if Barnard’s is the second-closest, and Lalande is the fourth, what’s the third one? Well, there are a few more red dwarfs (about 10 in this less-than-12-l.y. space), not shown in the drawing because... when I constructed it I didn’t have their exact coordinates! So I couldn’t plot them. One of them is called “Wolf 359”, and that’s the third one in distance from us. You can see the distances and other data of our 30 closest neighbors later in a table.
But first, let’s have is a comparative view of the sizes and temperatures (colors), of our most distinguished neighbors.
The stars are arranged by order of distance from us. The first row of numbers below the star names are their approximate sizes expressed in solar diameters (Sun = 1.0), and the second row is their approximate distances from us, in light-years (l.y.).
Doesn’t Procyon look a bit larger than Sirius? It actually is — in diameter. According to current estimates, Procyon is 1.77 solar diameters wide, while Sirius is at 1.43. Then why does Sirius appear with a larger dot than Procyon in our earlier 3-D plot? This is because in that one, and in the 3-D plots that follow, the size of the disk represents the “absolute magnitude” of the star. The absolute magnitude takes into account not only the diameter, but also the star’s luminosity (how bright the star is). Remember, we mentioned earlier that Sirius is 21 times brighter than the Sun, while Procyon’s luminosity is only 7 (times brighter than the Sun). Essentially, in our 3-D plots I try to show how big an impression the star would make on our eye’s retina if we were at the given vantage point in space. The estimated diameter of the star’s disk will be given in drawings like the one above, where the star disks are lined up. Once again, the colors I used are an approximation of the “real” colors. (What is real is the temperature: the hotter the star, the more bluish it appears; the cooler — the more reddish.)
Now here is the table I promised. All 30 of our closest neighbors are listed below, showing some of their other physical data as well.
| Star name | r.a. h | r.a. ´ | r.a. ´´ | dec. ° | dec. ´ | dec. ´´ | dist. (l.y.) | abs. magn. | vis. magn. | temp. (°K) | color code | diameter (sun = 1) | luminosity (sun = 1) |
| Sun | 0 | 0 | 0 | 0 | 0 | 0 | 0 | 4.74 | -26.73 | 5338 | G2 | 1.00 | 1.000000 |
| Proxima Centauri (HIP 70890) | 14 | 29 | 47.8 | -62 | 40 | 51.6 | 4.22 | 15.45 | 11.01 | 3470 | M5Ve | 0.02 | 0.000052 |
| Rigel Kentaurus (α¹ Centauri) | 14 | 39 | 40.8 | -60 | 50 | 6.0 | 4.39 | 4.34 | -0.01 | 5338 | G2V | 1.20 | 1.440436 |
| α² Centauri | 14 | 39 | 39.4 | -60 | 50 | 20.4 | 4.39 | 5.70 | 1.35 | 4510 | K1V | 0.90 | 0.411618 |
| Barnard’s star (HIP 87937) | 17 | 57 | 49.0 | 4 | 40 | 4.8 | 5.94 | 13.24 | 9.54 | 3000 | sdM4 | 0.06 | 0.000399 |
| Wolf 359 (Leo) | 10 | 56 | 30.0 | 7 | 1 | 0.0 | 7.7 | 16.70 | 3470 | M5 | 0.01 | 0.000016 | |
| BD +36° 2147 (Uma) | 11 | 3 | 20.0 | 35 | 58 | 0.0 | 8.2 | 10.50 | 3740 | M2 | 0.14 | 0.004966 | |
| Lalande 21185 (HD 95735) | 11 | 3 | 20.6 | 35 | 58 | 51.6 | 8.31 | 10.46 | 7.49 | 3740 | M2V | 0.15 | 0.005161 |
| UV Cet A,B | 1 | 38 | 50.0 | -17 | 57 | 0.0 | 8.4 | 15.50 | 3470 | M5 | 0.02 | 0.000050 | |
| Sirius (α CMa) | 6 | 45 | 9.4 | -16 | 42 | 46.8 | 8.6 | 1.45 | -1.44 | 9520 | A0m | 1.43 | 20.632968 |
| Ross 154 (HIP 92403) | 18 | 49 | 49.0 | -23 | 50 | 9.6 | 9.69 | 13.00 | 10.37 | 3675 | M3.5Ve | 0.05 | 0.000495 |
| Ross 248 (And) | 23 | 41 | 55.0 | 44 | 10 | 0.0 | 10.4 | 14.80 | 3470 | M5 | 0.02 | 0.000095 | |
| ε Eri | 3 | 32 | 56.4 | -9 | 27 | 28.8 | 10.49 | 6.18 | 3.72 | 4370 | K2V | 0.77 | 0.264921 |
| CoD -36° 15693 (HD 217987) | 23 | 5 | 47.3 | -35 | 51 | 21.6 | 10.73 | 9.76 | 7.35 | 3740 | M2/M3V | 0.20 | 0.009790 |
| Ross 128 (HIP 57548) | 11 | 47 | 44.2 | 0 | 48 | 28.8 | 10.88 | 13.50 | 11.12 | 3595 | M4.5V | 0.04 | 0.000312 |
| L789-6 (Aqr) | 22 | 38 | 30.0 | -15 | 19 | 0.0 | 11.2 | 14.50 | 3470 | M5 | 0.03 | 0.000125 | |
| 61 Cyg A | 21 | 6 | 50.9 | 38 | 44 | 27.6 | 11.35 | 7.49 | 5.2 | 3920 | K5V | 0.52 | 0.079352 |
| Procyon (α CMi) | 7 | 39 | 18.5 | 5 | 13 | 40.8 | 11.4 | 2.68 | 0.4 | 6440 | F5IV-V | 1.77 | 6.658471 |
| 61 Cyg B | 21 | 6 | 52.1 | 38 | 44 | 2.4 | 11.42 | 8.33 | 6.05 | 3878 | K7V | 0.36 | 0.036720 |
| BD +59° 1915 A (HD 173740) | 18 | 42 | 48.5 | 59 | 37 | 19.2 | 11.46 | 11.97 | 9.7 | 3920 | K5 | 0.07 | 0.001282 |
| BD +43° 44 A,B (HD 1326) | 0 | 18 | 20.6 | 44 | 1 | 19.2 | 11.63 | 10.33 | 8.09 | 3835 | M1V | 0.15 | 0.005817 |
| BD +59° 1915 B (HD 173739) | 18 | 42 | 48.2 | 59 | 37 | 33.6 | 11.63 | 11.18 | 8.94 | 3920 | K5 | 0.10 | 0.002659 |
| ε Ind | 22 | 3 | 17.5 | -56 | 46 | 48.0 | 11.82 | 6.89 | 4.69 | 3920 | K5V | 0.69 | 0.137657 |
| τ Cet | 1 | 44 | 5.0 | -15 | 56 | 24.0 | 11.89 | 5.68 | 3.49 | 4670 | G8V | 0.85 | 0.420657 |
| HIP 5643 | 1 | 12 | 30.0 | -17 | 0 | 3.6 | 12.12 | 14.25 | 12.1 | 3470 | M5.5Ve | 0.03 | 0.000157 |
| Luyten’s star (HIP 36208) | 7 | 27 | 24.2 | 5 | 14 | 6.0 | 12.38 | 11.94 | 9.84 | 3470 | M5 | 0.09 | 0.001315 |
| Kapteyn’s star (HD 33793) | 5 | 11 | 35.3 | -45 | 0 | 14.4 | 12.77 | 10.90 | 8.86 | 3878 | M0V | 0.11 | 0.003451 |
| HD 202560 | 21 | 17 | 17.8 | -38 | 51 | 54.0 | 12.87 | 8.71 | 6.69 | 3835 | M1/M2V | 0.31 | 0.025866 |
| Kruger 60 (HD 239960) | 22 | 28 | 0.5 | 57 | 41 | 49.2 | 13.07 | 11.57 | 9.59 | 3740 | M2V | 0.09 | 0.001846 |
| HIP 30920 | 6 | 29 | 23.0 | -2 | 48 | 43.2 | 13.42 | 13.05 | 11.12 | 3595 | M4.5Ve | 0.05 | 0.000475 |
The “abs. magn.” is the absolute visual magnitude of the star, which tells us how bright the star would appear if it were located at a distance of 10 parsecs from us; smaller numbers imply a brighter star. The “vis. magn.” is the apparent visual magnitude, which is how bright the star appears from Earth; once again, smaller numbers imply a brighter star (that’s why the Sun has a very small number, -26.73, because it appears very bright to us). The luminosity (last column) shows how much brighter than the Sun the star is. The color codes are: A = bluish-white, F = white, G = yellowish, K = orangy, M = reddish. (There are also the codes O = violet, and B = bluish, not possessed by any star in the table above.)
Now let’s take a step back (in space), and watch our neighborhood from a vantage point which is 25 l.y. away from Sun.
If you click here, or directly on the above stereograph, you will be moved to a page where the stars will start rotating around the vertical axis, with Sun at the center. Motion through rotation gives a much better 3D perspective than the static stereographs above. This is probably because our visual system is designed to integrate motion and 3D-space in a way so that the total is more than the sum of its parts (motion + 3D). You are warned, however, that the size of the rotating picture in the linked page is around 265 KB (like an average-sized picture from an average commercial site), so it may take a bit longer than the pictures of this page to load it into your browser — especially if you have a slow modem connection. In this case, wait until a full rotation is completed; after that, the whole contents of the picture are loaded, and the rotation should proceed smoothly.
Enough about our immediate neighborhood. How about expanding our horizon a bit?
Please note that although the angles for each star (right ascension and declination) are known to great accuracy, the same is not true for their distances. In general, the farther the star, the less accurately we know its distance. However, all distances of stars on this page should be quite accurate (because they are the closest ones to us).
To construct the above drawings I used data from the Hipparchus database, and from Richard Dibon-Smith’s StarList 2000 (John Wiley & Sons, New York 1992, ISBN 0-471-55895-8). The 3-D plots and the comparative star-size figures were done by a program of mine, whose interface, unfortunately, is not designed yet with the idea of somebody else — other than me — using it. When I improve that, I’ll make it publicly available.